How We Built a Power BI Dashboard Tracking $1M+ in Retail Revenue
When a growing retail business came to us, they had a familiar problem: over $1 million in revenue flowing through their operations, but no single place to see it all. Sales data lived in spreadsheets. Inventory counts were updated manually. Marketing performance was tracked in a separate tool entirely.
Leadership was making decisions on gut instinct because pulling together an accurate picture took days. By the time the data was ready, the moment had passed.
The Problem with Scattered Data
This is one of the most common patterns we see with mid-sized businesses. They have plenty of data, but it lives in five different places and nobody trusts any single source. The result is paralysis: teams default to whatever feels right instead of what the numbers actually say.
The client needed a single source of truth that their entire team could access without asking the "data person" to pull a report. It had to be fast, visual, and updated automatically.
What We Built
We started by consolidating their data sources into a single pipeline. Raw sales transactions, inventory records, customer data, and marketing metrics all flowed into one clean dataset.
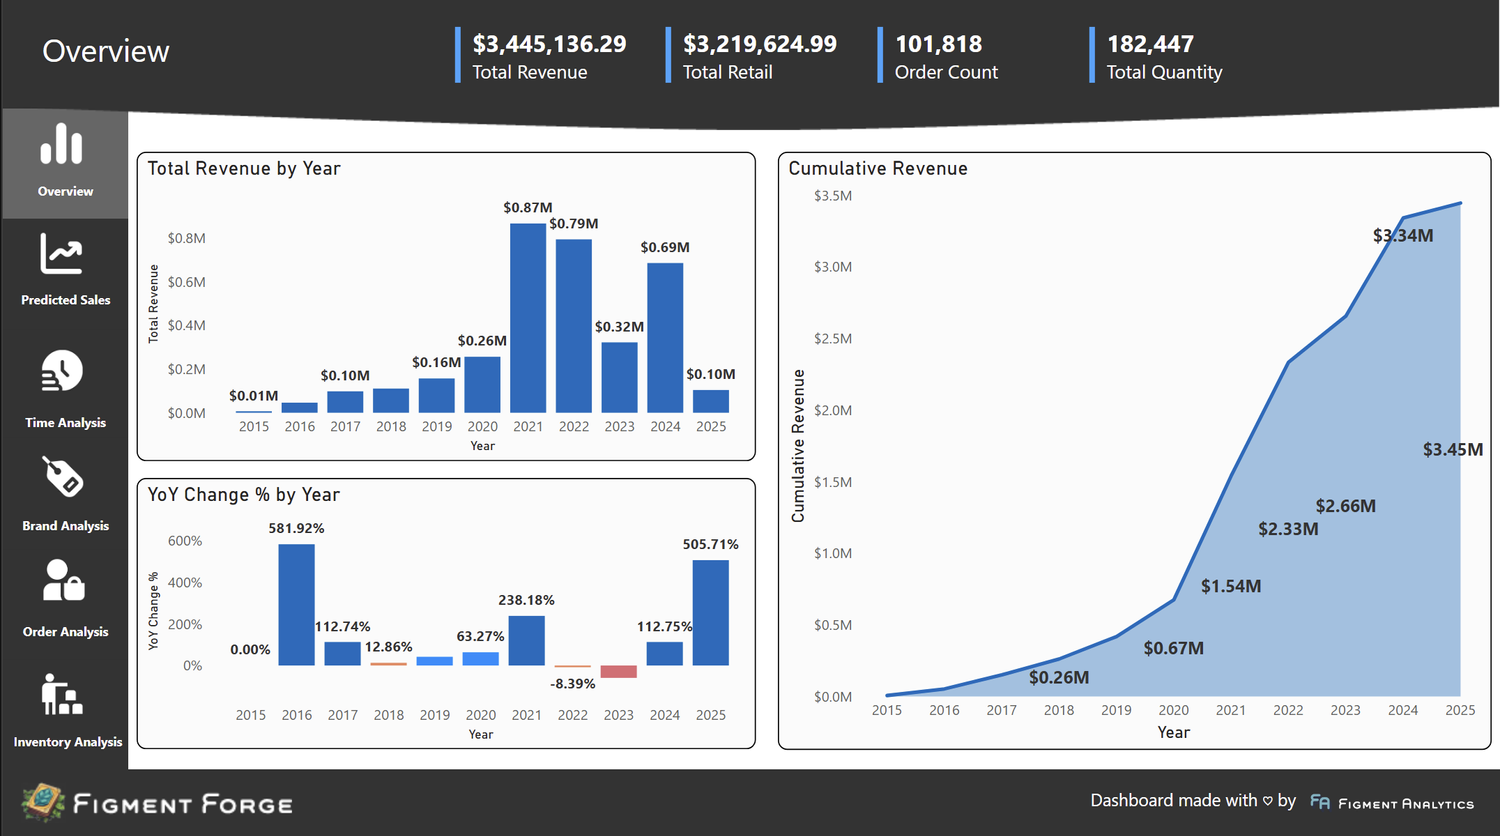
From there, we built Figment Forge: a six-page Power BI dashboard covering every angle of their business.
- Sales Performance: Revenue trends, order volume, and average order value over time
- Brand Analysis: Side-by-side comparisons showing which product lines drive margin and which drag it down
- Customer Segmentation: Data-driven customer groupings for targeted marketing
- Inventory Health: Real-time stock levels tied to sales velocity
- ML Forecasting: Python-built models predicting future sales trends
- Executive Summary: One page with the numbers that matter most
The ML Forecasting Layer
The forecasting component was built in Python using historical sales patterns, seasonal trends, and external variables. We trained the models on 109K+ orders, validated them against hold-out periods, and integrated the predictions directly into the Power BI dashboard.
This gave the client something most mid-sized retailers don't have: a forward-looking view of their business based on actual data, not a spreadsheet formula someone wrote three years ago.
What Changed for the Client
Within the first week, the client's leadership stopped asking for ad-hoc reports. The dashboard became the default starting point for every planning conversation. Inventory decisions that used to take days of back-and-forth now happened in a single meeting with the dashboard on screen.
The forecasting models flagged a seasonal demand spike two months early, giving the team enough runway to adjust their purchasing and avoid both overstock and stockouts.
Lessons for Your Business
You don't need a data warehouse to start getting value from your data. (Not sure if Power BI is the right tool? Read our Power BI vs Tableau comparison.) If your team is making decisions on gut instinct because pulling together an accurate report takes too long, a well-built dashboard can change that in weeks, not months.
The key is starting with the decisions you need to make, not the data you happen to have. We always ask clients: "What question do you wish you could answer right now?" That question shapes the entire project. If you are wondering whether your business is ready for this kind of engagement, read why mid-sized businesses are choosing fractional data teams.
If this sounds familiar, explore the live Figment Forge dashboard or book a free consultation to talk about what a dashboard could look like for your business.