
A retail analytics dashboard that turns $1.18M+ in revenue data into actionable insight.
A growing retailer needed visibility into $1M+ in revenue across thousands of orders, but their data was scattered across spreadsheets and disconnected systems. Without a proper data pipeline, leadership was making inventory and marketing decisions on gut instinct, and it was costing them.
We consolidated their fragmented data sources into a single pipeline, built ML forecasting models in Python, and delivered everything through an interactive Power BI dashboard their team could use without training.
The result: six purpose-built dashboard pages covering sales performance, brand analysis, customer segmentation, inventory health, trend forecasting, and an executive summary, all updated in real time.
Machine learning models that predict future sales trends, helping the client plan inventory and marketing spend.
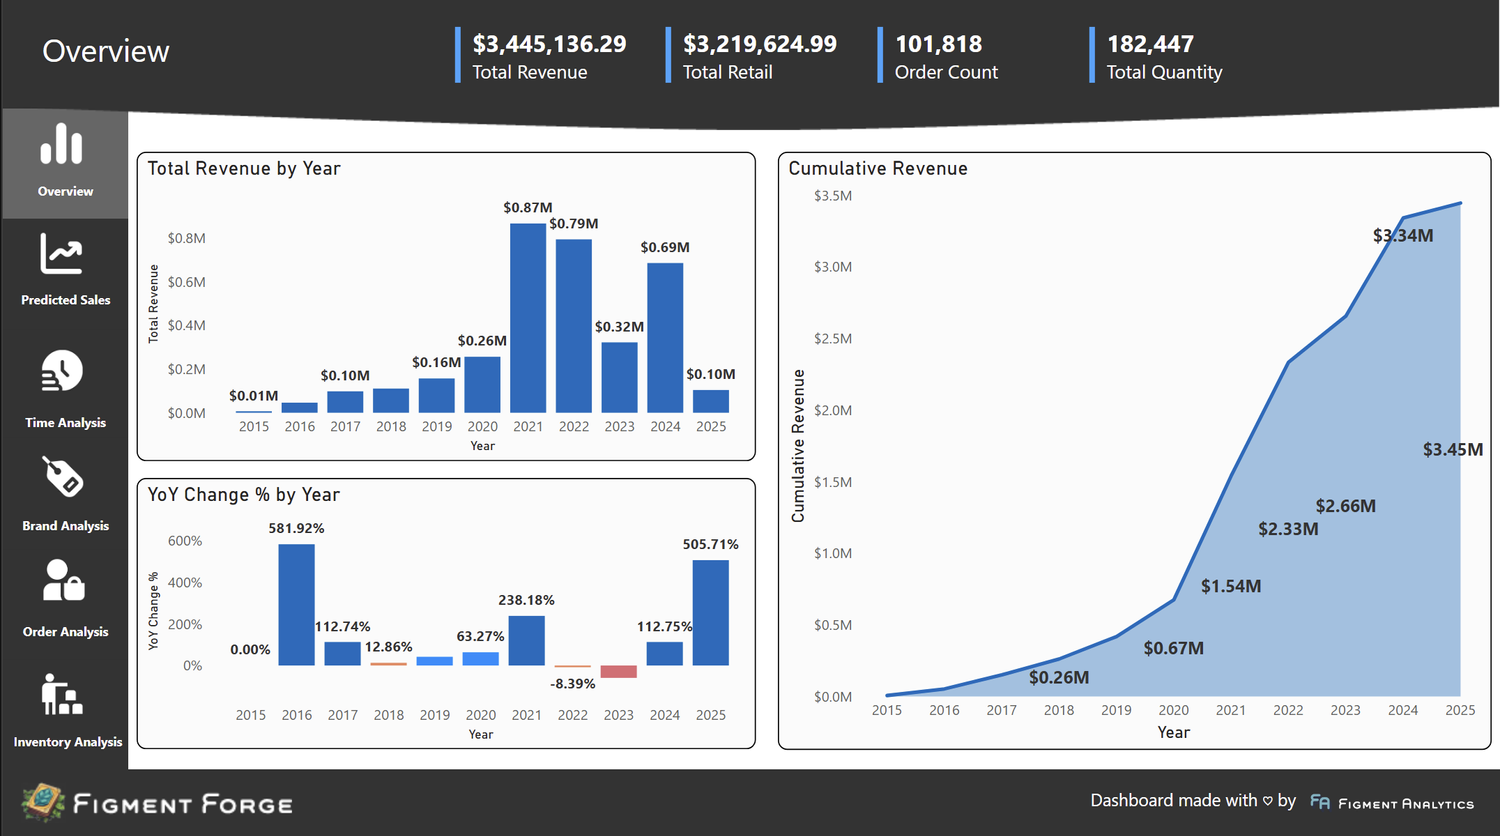
Historical performance tracking across multiple dimensions, surfacing seasonal patterns and growth trajectories.
Side-by-side brand analytics revealing which product lines drive revenue and which underperform.
Data-driven customer groupings that enable targeted marketing and personalized engagement strategies.
Live stock monitoring tied to sales velocity, reducing overstock waste and preventing stockouts.
A complete analytics suite covering sales, customers, products, trends, forecasts, and executive summary views.
Before the dashboard, generating a monthly sales report took the team the better part of a day: exporting from multiple systems, cleaning in Excel, and manually building charts. With Figment Forge, that same report is always live and always current. What used to take hours now takes a glance.
The ML forecasting models gave leadership forward visibility they never had before. Instead of reacting to inventory shortages after they happened, the team could see demand shifts weeks in advance and adjust purchasing accordingly. Brand performance comparisons revealed that two product lines were consistently underperforming relative to shelf space, leading to a reallocation that improved margins.
Customer segmentation uncovered a high-value repeat buyer segment that was not being targeted in marketing. By identifying these customers and their purchasing patterns, the team launched a focused retention campaign that turned one-time buyers into regulars.
Interact with the live dashboard below. All client data has been anonymized for this showcase.
Read the full case study on our blog for a deeper look at how the dashboard was designed and the decisions behind it. You can also explore our LA 311 Dashboard and SurfUp projects for more examples of how we turn raw data into interactive analytics.
We build analytics dashboards tailored to your data. Book a free 30-minute call and we'll map out what yours could look like.
or email us directly at mazen@figmentanalytics.com