
Here's what it looks like when data stops collecting dust and starts driving decisions.

An interactive analytics dashboard built from 369,000+ City of LA 311 service requests. Features time-series analysis, geographic mapping, neighborhood comparisons, and resolution time breakdowns, all powered by pre-computed aggregations from public open data.
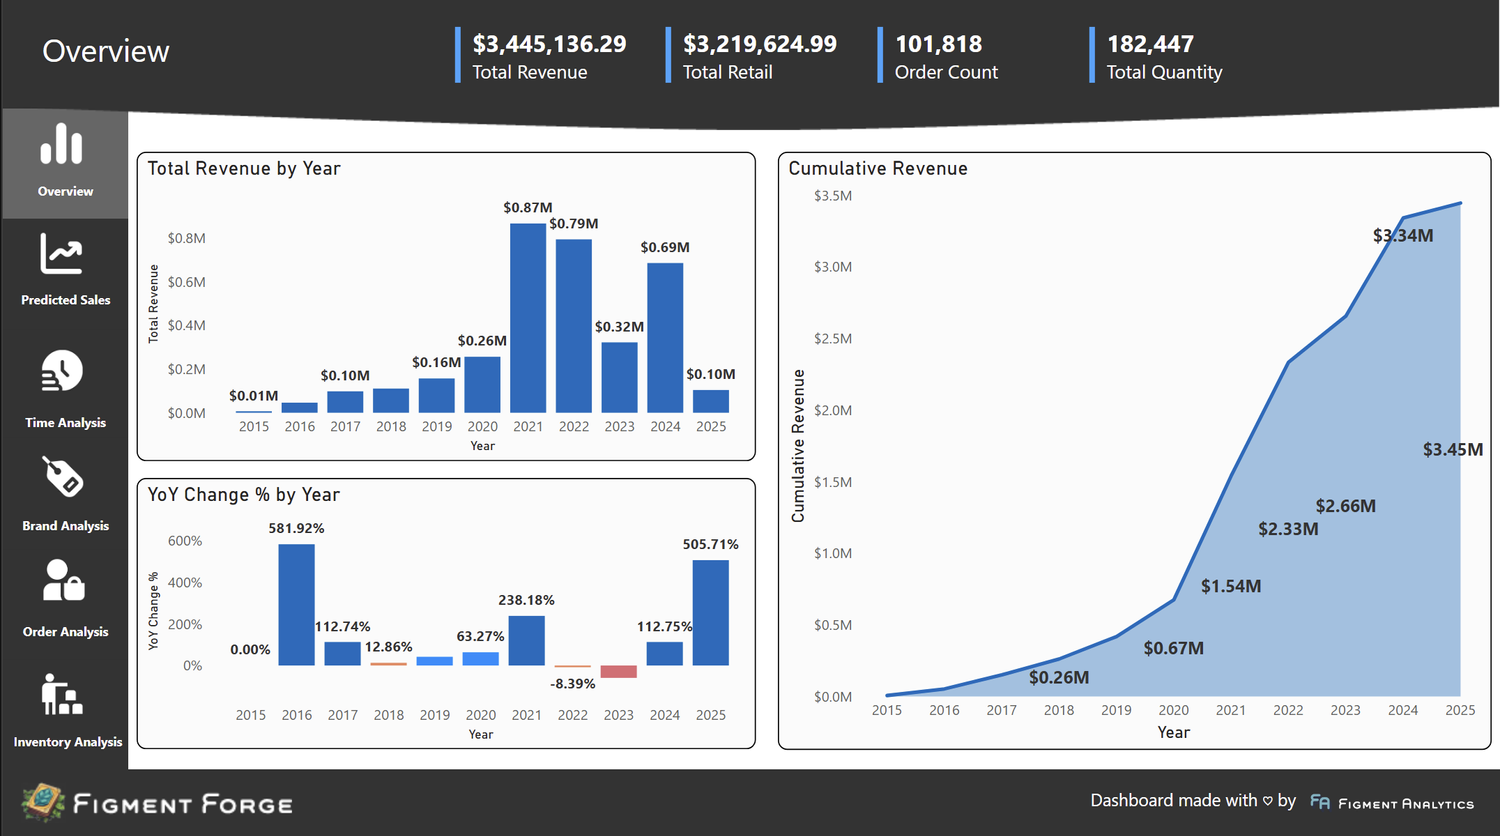
A Power BI analytics dashboard built for a retail client, tracking $1.18M+ in revenue across 109K+ orders. Features ML-driven sales forecasts, time-series trend analysis, brand performance comparisons, customer segmentation, and real-time inventory tracking. All client data was anonymized for this showcase.

Analytics and operations dashboards for a contactless surfboard rental platform launched in San Diego. Built revenue tracking, rental analytics, and partner portals as CPO. Featured on ABC 10 News, CBS 8, and the San Diego Union-Tribune.

An interactive geospatial flight tracking demo that brings aircraft data to life on the map. Visualizes aircraft positions, flight paths, and altitude data with temporal filtering, individual aircraft tracking, and altitude-based coloring. Built to showcase what's possible with location-based data.

A free multi-game companion platform for tabletop gamers with 7+ supported game systems. Features real-time multiplayer drafting rooms, AI opponents, deck building tools, and companion apps. Built and maintained by our team as a live product with an active user base.
Every week without analytics is another week of decisions made on gut instinct. Book a free 30-minute call and we'll show you exactly where your data can drive revenue.
or email us directly at mazen@figmentanalytics.com